
 The cold hard truth is that we are in the tightest market ever experienced; demand is higher than ever, supply is lower than ever, and there may not be an end to this for the rest of 2020. The supply of homes for sale is determined by dividing the total number of homes for sale over the number of homes that went pending (accepted a contract) in one month. If Massachusetts, for example, has 12,000 homes for sale and 3,000 sold in one month, we’d have four month’s supply, which tends to be the average. But that is not the case by far.
Click to enlarge
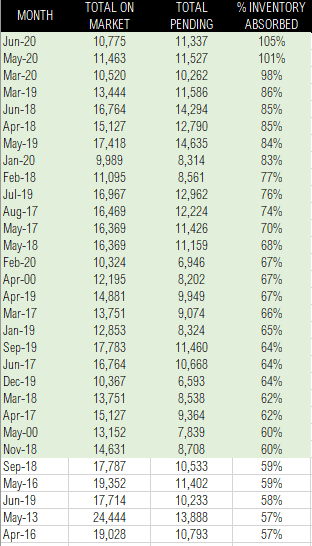
In June of 2020, there were 10,775 homes listed and 11,337 that went pending, leaving a .95 month’s supply available, and historically speaking, it has never been this low. We are at anemic levels where homes are going off the market significantly faster than they are listed which is what is referred to as the monthly absorption rate.
With an absorption rate this high, now at 105% – which as you can see in the chart below and in the data to the right- is higher than ever and therefore officially the hardest year on record for buyers so far. Inventory is so limited that securing a home is possibly more difficult than it was during the housing crisis when mortgage companies were completely unreliable.
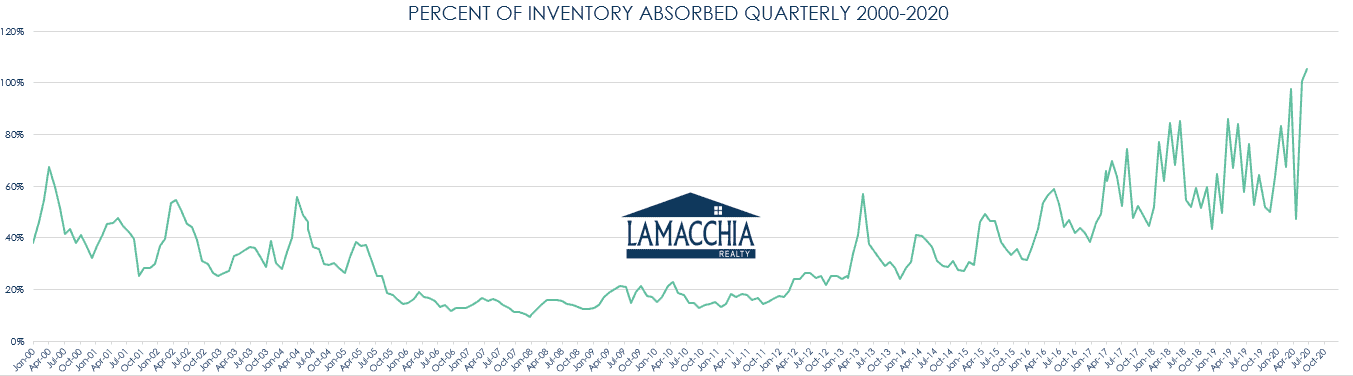
Absorption Rate is over 100% this quarter. Click to enlarge.
It’s not just that there are more buyers out there than there are sellers, which is a normal set of circumstances in a typical seller’s market, and though that is the case and they’re voraciously consuming the inventory (aka absorption rate), it’s also that seller’s aren’t listing as much as they typically would this time of year. Certainly not enough to compensate for the decimated spring market due to the COVID outbreak.
Sellers have fears and they are not totally unfounded. Many sellers have pulled back from listing because they’re concerned that they’ll sell faster than they’ll find a new home, and be left with nowhere to live and they have safety concerns caused by the pandemic making them hesitant to have buyers in their home.
The short answers to these concerns are that your agent will help ensure a selling and buying timeline that works for you, and that there are ways to buy and sell safely now that we know more about preventative measures with regard to COVID.
But what does seller hesitation look like in terms of numbers? On the last day of June 2019, there were 17,714 homes listed, and the same day in June of 2020, there were 10,775 listed which is a 39.2% decrease. This significant decrease seems even more significant when you remember that the last three years have been alarmingly low in inventory with a dramatic increase in buyer demand. It has set the stage for the current situation which is a perfect storm.
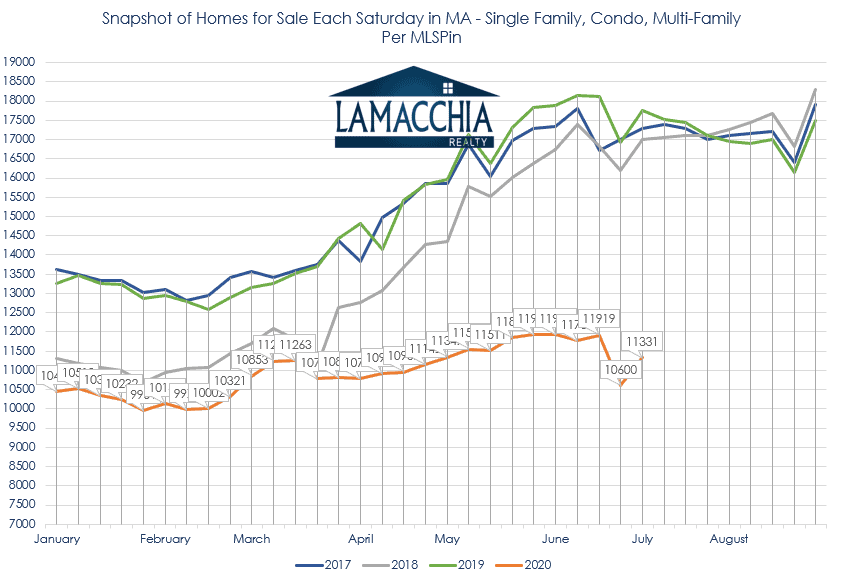
As is stands, it’s very clear that we are not going to make up ground for the lack of inventory during the spring as sellers aren’t selling at a high enough rate to compensate for the pause in listings. In the chart below, the orange line for 2020 shows that the year started with lower inventory than the previous three years and then shifted its usual upward spring trend to a plateau when COVID hit. The hope was that restless sellers would list in droves in April or May, but that much-needed spike just didn’t happen. With this 39.2% decrease year over year, we’d be lucky if we get to 13,000 listings this summer.
Click to enlarge
If you examine the number of homes that have gone pending in the chart below, it’s the opposite set of circumstances in that more homes have gone pending this year than last. The light green line which represents pendings is trending higher than it has been in the past 20 years, in fact, it’s 105% higher this year than last. In 2008 during the crisis, only 16% of homes that were listed went pending which was a very low absorption rate. If you look at the blue line in the chart below, you can see how many homes were listed on the market in 2008. It was saturated compared to now when listings are lower than they’ve ever been, causing a market that is very frustrating for buyers.
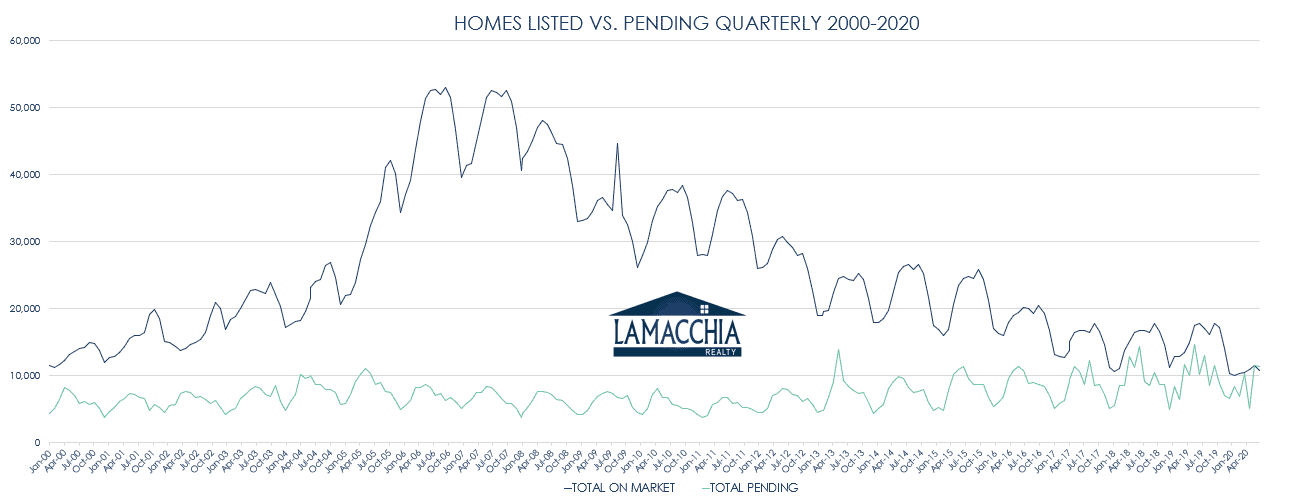
Click to enlarge.
Ultimately, this intense seller’s market means that sellers will likely sell for more as prices will likely continue the upward trend we’ve been seeing over the past few years due to the multiple offer situations we typically see in tight markets that turn into bidding wars. This will give sellers more to work with when it’s their turn to buy. Fortunately, interest rates are lower than ever which is helpful for buyers as they prepare for these bidding wars.
As well, because of this current market’s next level intensity, sellers (buyers as well) NEED to be working with an experienced agent that knows how to navigate this set of circumstances. Now is not the time to hire family or a friend if they’re not prepared to properly represent you during this hypermarket.