

The Lamacchia Housing Report presents overall home sale statistics and highlights the average sale prices for single families, condominiums, and multi-family homes in Massachusetts and New Hampshire for June 2021 compared to June 2020. It also looks at other metrics in Massachusetts like Homes Listed for Sale, Homes Pending, and Price Adjustments made to active listings, as they are often the best indicators for predicting future trends in the market. This month’s report will address the lingering effects of COVID and the massive amount of home sellers that didn’t list last year, and so 2019 will be discussed to compare this month to a market not impacted by a pandemic.
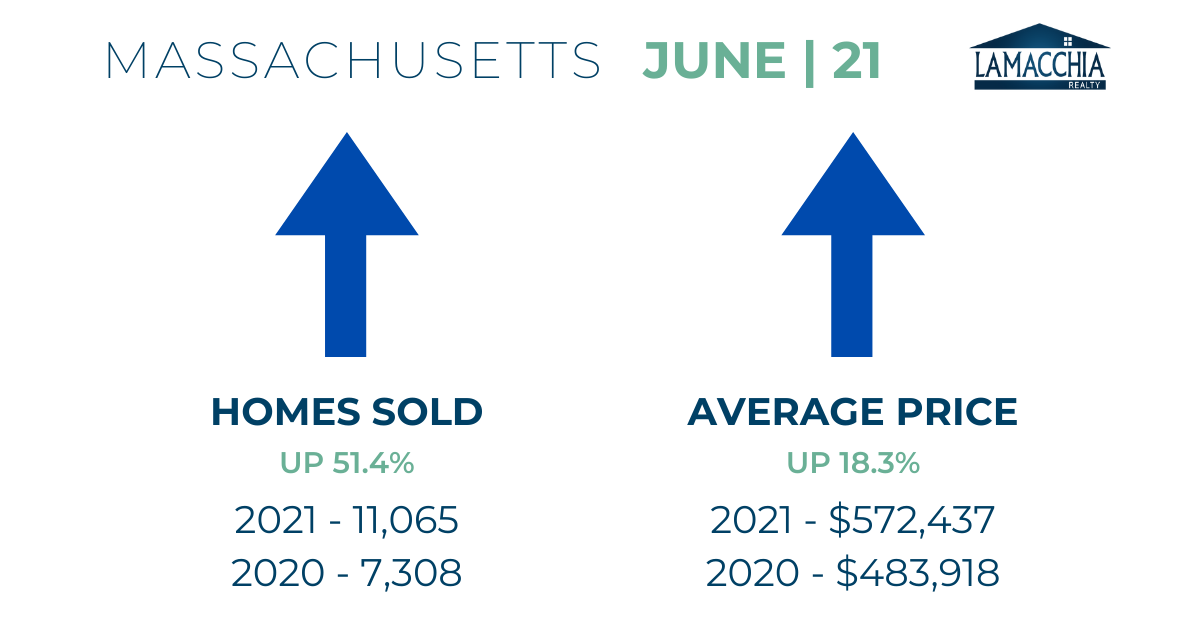
Massachusetts Home Sales Up 51.4%
Year over year, sales increased by 51.4% up to 11,065 from 7,308 sales in June 2020. Sales increased in all three categories; by 39.1% for singles, by 74.6% for condos, and by 91.6% for multi families. Condos and multis saw major increases due to last year’s artificial reduction in sales in communal living during the pandemic. With vaccinations and safety measures in place, condos and multi-families are back in demand. Single family average prices are now higher than multi-family average prices, which is also why multis and condos are more in demand. They’re more affordable.
Average prices for 2021 are up to $572,437 from $483,918 in 2020, a 18.3% increase. Average prices increased in every category with singles now up to $651,299, condos up to $432,476, and multis up to $625,221.
If we compare 2021 to 2019, however, the number of sales increased by 12% and prices increased by 23.4%. Sky-high demand has caused these increases as the market is currently very hot with buyers and sellers trying to accomplish now what they couldn’t over the past year.
Homes Listed For Sale:
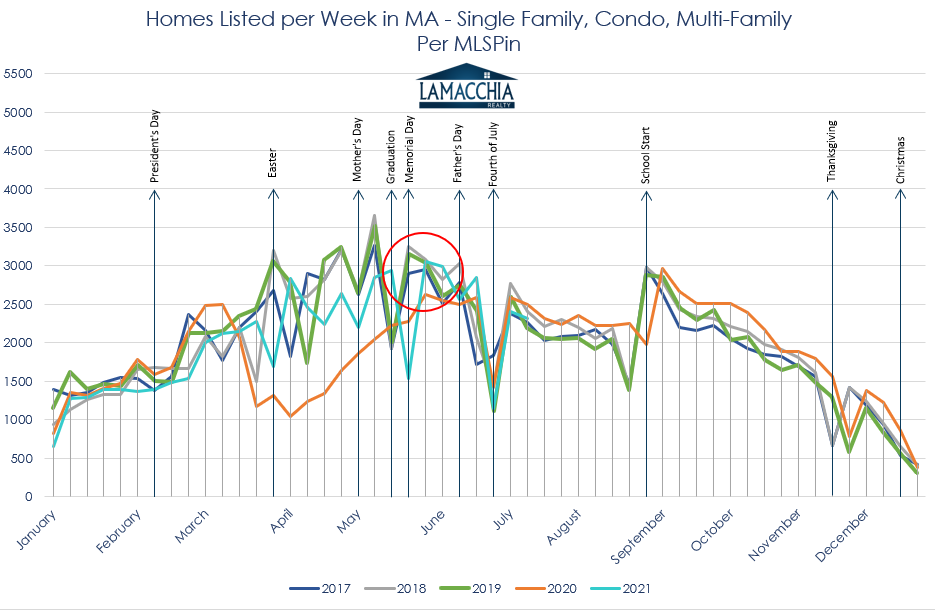
Single families, which took the hardest hit in terms of supply, due to a lack of listings and the fastest absorption rate in history, are finally now up over both 2020 and 2019, by 6.9% and 0.2% respectively. There were 7,439 single families listed in 2021, 6,927 in 2020, and 7,423 listed in 2019.
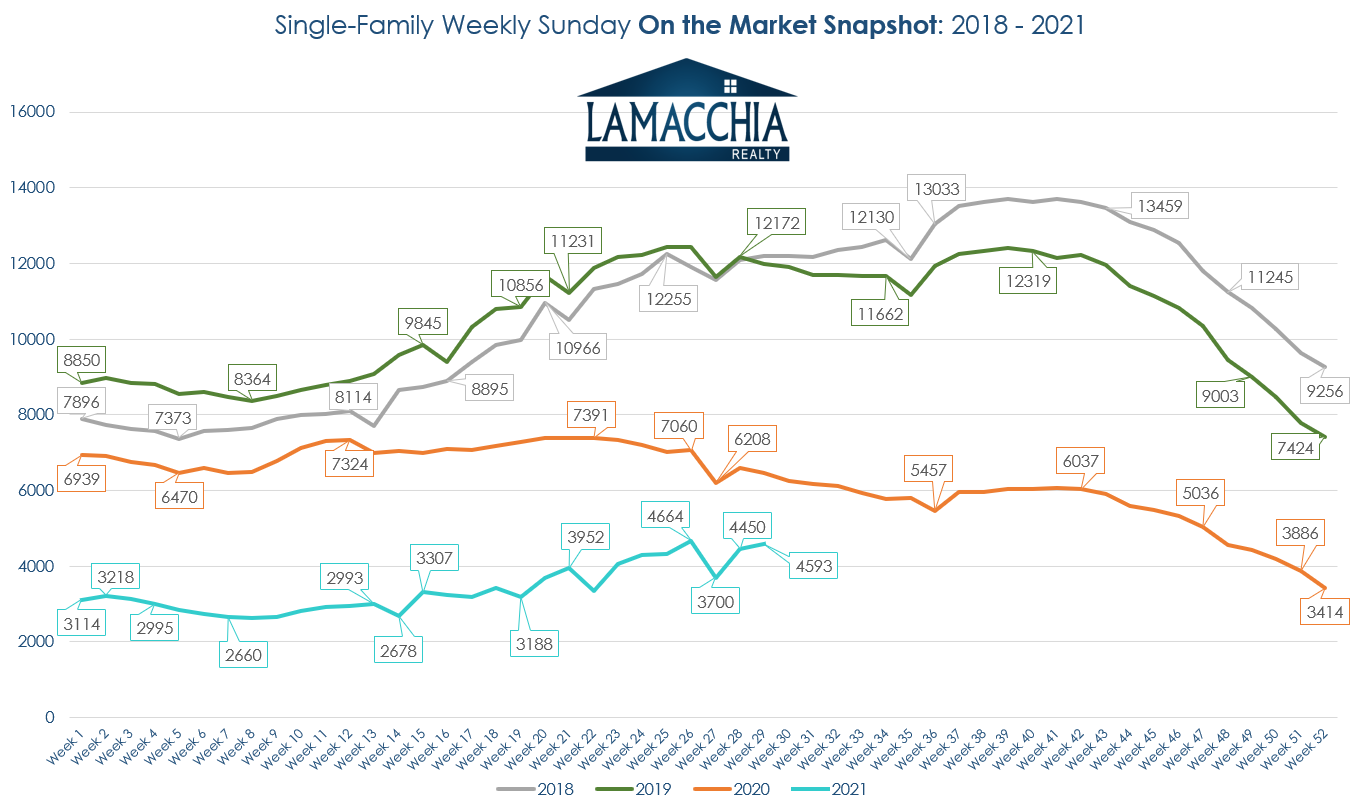
In the chart below, you can see how strong demand for single families still is. Even though the number of listings is up over the past two years, available inventory is still down significantly because they’re being placed under agreement almost faster than they’re being listed.
Pending Home Sales:
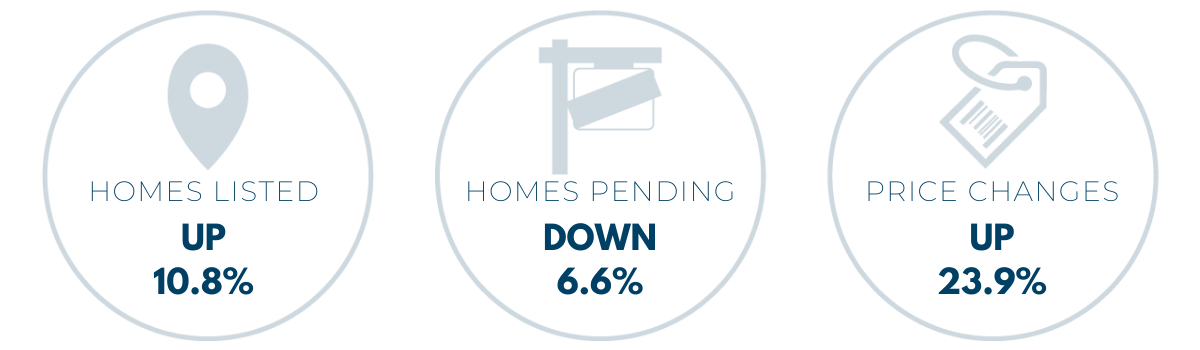
The number of homes placed under agreement is down year over year from June 2020 by 6.6% but up over 2019 by 3%. There were 10,542 homes placed under agreement in 2021, 11,281 in June of 2020, and 10,233 in 2019.
June was a very active month in 2020 as the log jam that occurred during the shut-down started to alleviate and those active buyers were able to start to secure the homes they couldn’t during the stay-at-home mandate.
It’s a good thing for buyers to see a slight decrease in pending sales- it means that inventory is given a chance to catch up and hopefully give buyers a little more selection. This may not last long, however, as many of these pending home sales are contingent on these buyers listing their own homes and selling. In many cases, the buyers whose offers are accepted with home-sale contingencies are quickly becoming sellers listing their homes
Price Changes:
Price changes increased by 23.9% with 965 adjustments in June of 2021 over 779 in 2020. This number is down from 2019, as there were 1,028 price adjustments. Inventory was higher in June of 2019 which is partially why there were more adjustments. June of last year didn’t need as many price changes as what’s typical due to the fact that the market was starved for inventory due to the pandemic and buyers were willing to pay what sellers wanted.
Sellers who list in early summer should be careful targeting their list prices on what they think they can get based on the winter market, when prices are naturally higher as buyers are the ones competing for fewer homes. The warm weather typically sees a higher number of listings, and the more selection buyers have, the more sellers are the ones that have to compete by being aggressive and reasonable with their prices.
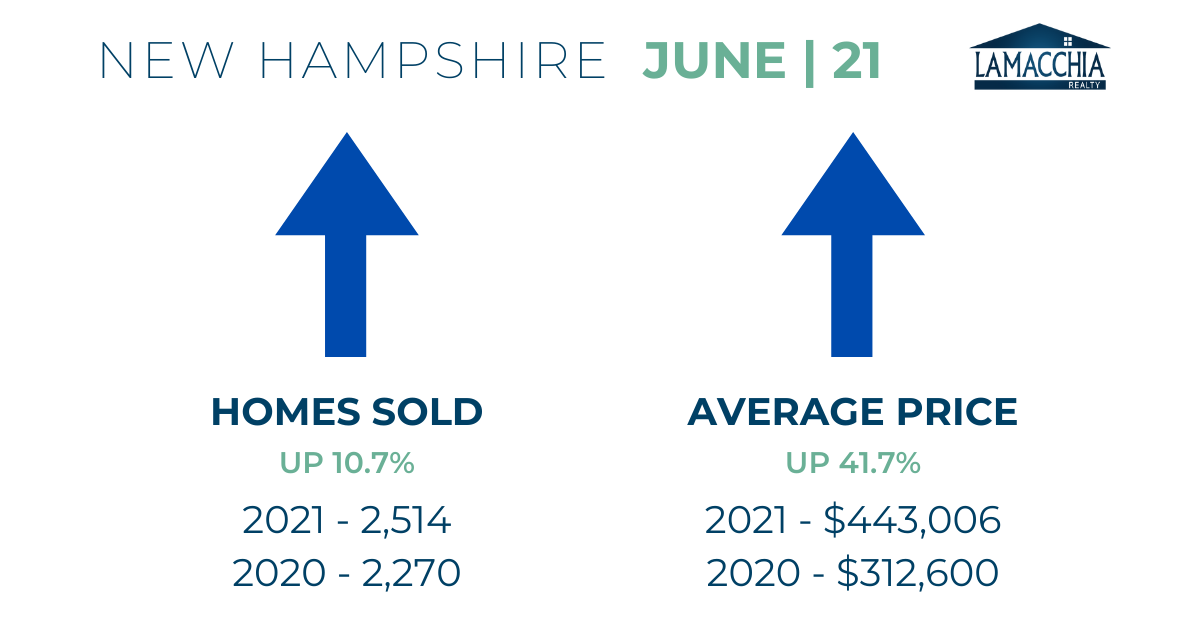
New Hampshire Home Sales Up 10.7%
Sales and prices increased in New Hampshire by 10.7% and 41.7% respectively.
There were 2,514 sales in June 2021 over 2,270 in 2020 with increases in all three categories.
Prices increased by 41.7% year over year, with June coming in at $443,006 compared to $312,600 in June 2020. All three categories experienced increases in average prices.
What’s Ahead?
As interest rates continue to reside around the 3% mark and keep buying more affordable, we are going to continue to see an active market. It’s not likely that we will see the second half of the year become balanced or the buyer’s market that we are used to before the 2020 Pandemic impacted inventory. It’s possible that interest rates may begin to increase by year’s end, so current buyers are in the best position by securing a mortgage now. Prices continue to increase, so the low mortgage rates are essential to help maintain affordability for buyers. Currently, rates are back down, so buyers with pre-approvals in hand may need to reach out to their lender to see if the new rates boost what they can afford.
We are seeing those “want to be sellers” who hesitated to list earlier this year start to list more and more so buyers will have more selection as we get further into summer, and will hopefully not have to compete as much to secure a home. More selection does mean that homes will sit on the market a little longer, so buyers will need to be advised that there’s nothing wrong with the house if others aren’t lining up out the door to see it, or if the home takes longer than 48 hours to accept one of many offers.
Sellers are starting to have to adjust their prices more frequently, which shows that listing prices need to be based on what has sold recently and not what sold in the winter market, when inventory was tighter. The market is trying to catch up to where it would have been had COVID not put a massive wrench in the works, but it’s not quite there yet.
Data provided by Warren Group & MLSPin for MA, and by NEREN for NH then compared to the prior year.