2021 Massachusetts Year in Review

Sales Up by 7.9% in Massachusetts

The 2021 Massachusetts Year in Review Housing Report breaks down average prices, sales, inventory, new active listings, and pending sales for 2021 compared to 2020 and illustrates what that means for the current market.

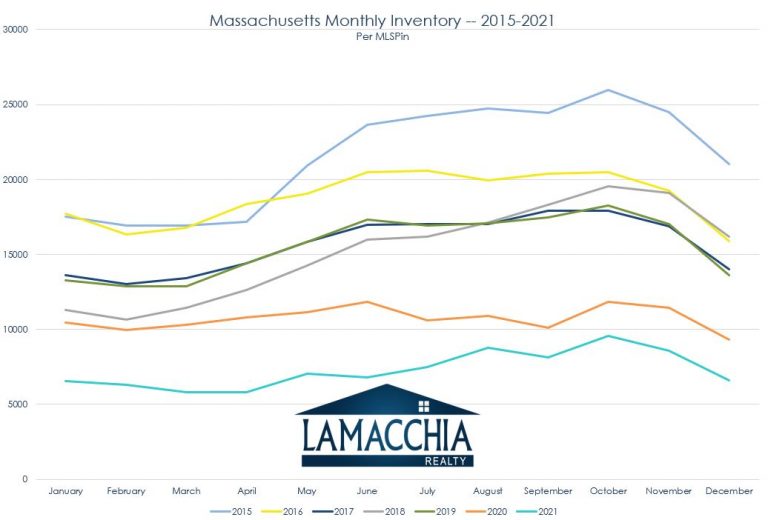
2021 was a historic year for the post-pandemic real estate industry with record-low mortgage rates, record low inventory, and record high absorption rate and sales.  It’s the best example of how supply and demand determine the market climate in that with high demand and low supply the market becomes a frenzy for buyers.  It was also a clear rebuke of the theory that the Covid pandemic would cause a similar crash to 2008.

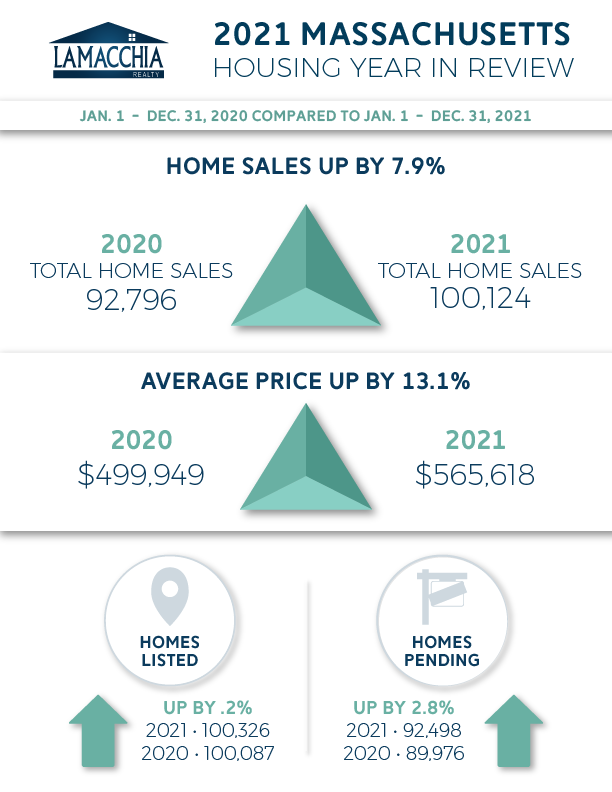
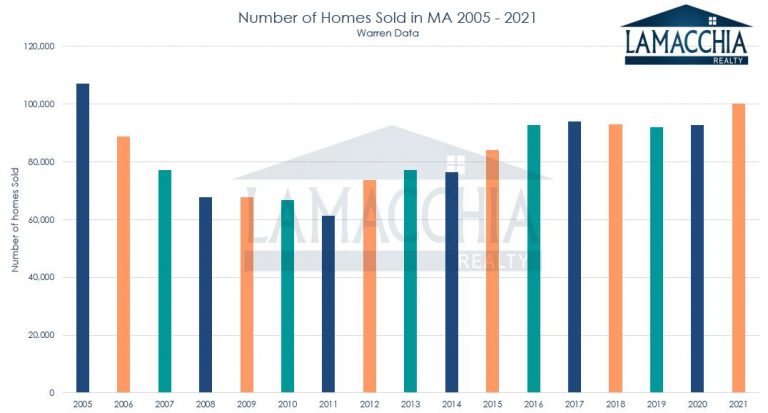
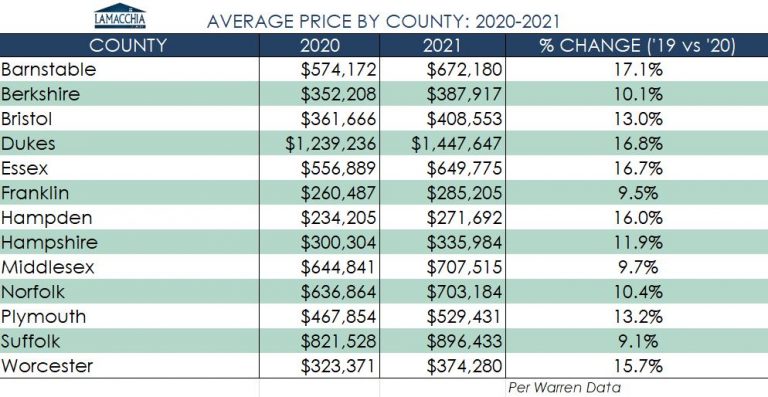
Sales for Massachusetts increased to over 100,000 sales as predicted by Anthony Lamacchia last January and prices increased by over 13%. Both sales and prices were up significantly over recent years- prices are the highest they’ve ever been.

Below is a graph that illustrates home sales per year since 2005.


Below is a graph that illustrates monthly home prices since 2005.  You can see that 2021 was much higher than 2020, but also take note of where prices for January 2022 landed.

2021 Sales by Month

2021 monthly sales were up over 2020 from January through August but were down September through December. This is why it was considered the best fall to buy in two years.  Competition was down, rates were still low and with less competition there was a likelihood that a buyer could score a home without a bidding war.  With sales being up for 60% of the year, inventory took a huge hit and was being absorbed almost as quickly as it was being made available.

Single family sales increased by 1.1% to 61,977, condos increased by 17.7% to 28,351, and multifamily sales rose by 32.1% to 9,796.  Overall sales rose to 100,124 from 92,796, a 7.9% increase.

Take a look at the chart below which depicts home sales monthly from 2019 to 2021.

Prices Up by 13.1% in Massachusetts

Prices very clearly skyrocketed in 2021 when compared to previous years, again because demand was so high and supply was so low, sellers could almost name their price.  Sellers who priced according to market value, and not too high, ended up getting much more for their homes than asking as buyers competed in bidding wars.  This phenomenon caused prices to rise at the rate they did.

Prices for single families increased by 15.9% to $633,518. Condos increased by 6.5% to $431,607 and multifamily prices increased by 14.32% to $620,291.  Overall prices jumped up 13.1% to $565,618.

Monthly prices are illustrated in the chart below comparing 2019 to 2021.

Home Prices per County

Prices in every county increased from 2020 to 2021, with the greatest increases in counties further from Boston. It’s expected that we’d see increases everywhere with prices in the state increasing by such a large percentage.  The market is intense everywhere and this shows that demand is high all over the state as buyers are willing to pay more and move further away from the city and coast.

Inventory of Homes for Sale

The first week of January 2020 had 10,455 homes for sale compared to the first of January 2021 with 6,546.  That’s a 37.4% decrease of available homes for sale.  2021 was already set up for tight available inventory considering the high demand incited by the pandemic shutdowns.  Everyone wanted to make sure that if they were stuck at home it would be the right one to suit their spatial needs.  Every month in 2021 exhibited lower inventory than all years prior which is why the inventory ended up becoming the lowest on record as you can see in the chart below.

Homes Listed for Sale

If you follow the turquoise line in the chart below you’ll see that the number of homes listed wasn’t dramatically lower than any other year! That’s surprising considering low inventory is, isn’t it?  That’s because the anemic inventory isn’t entirely due to fewer sellers.  It has more to do with buyer consumption. The number of homes listed was up by a slight .2% from 100,087 to 100,326 overall for the year.

Pending Home Sales (contracts accepted)

In the chart below, the number of homes placed under agreement shows what the rate of buyer consumption does to the number of homes listed. We call it the Pac-Man effect in that as soon as a home is listed on the market, it’s consumed (eaten) by a buyer just like the game of Pac-Man.  The number of pending sales is up by 2.8% to 92,498 from the 89,976 that went pending in 2020.

2022 Outlook

2021 set the stage for a highly competitive beginning to the new year and, according to Anthony’s 2022 Predictions, the entirety of 2022 is going to be a wild ride.  There are a few reasons for this.

The first is that inventory will continue to remain low due to how fast homes are being sold, some of which never make it to the open market.  Buyers are very much out there in full force outnumbering the number of sellers creating that supply and demand tension.

Prices show no signs of decreasing. Prices are directly linked to demand which is predicted to remain high over the year.  We might see the rate of increase diminish as mortgage rates are going to continue to increase over the year. Mortgage rates are currently at about 4% which is more than a point higher than a year ago at this time.  Buyers may not be able to throw as much money around in bidding wars if borrowing is going to be more expensive over the year and that might help prices.

The fact that the loan limits increased for 2022 is going to help buyers obtain affordable Conventional mortgages for higher amounts but, again, the rates themselves are increasing which diminishes buying power.  Rates increase with a strong economy (which we can see with low unemployment and strong inflation) and now in particular, because the Fed is diminishing how much money they’re flooding into the market.

Overall, the more sellers list the better for the market.  There are a lot of want-to-be sellers out there itching to take advantage of their climbing equity but feel hesitant due to concerns of not finding their next home in time.  If more sellers list that problem becomes less of an issue because there will be more available inventory.  Sellers should prep their home and list as soon as possible to take advantage of the motivated buyers out there and the low inventory.

Buyers should be ready to strike as soon as they find the home they want by preparing themselves to make the strongest offer.