
The Lamacchia Realty Monthly Housing Report highlights home sale statistics, average sales prices, the number of homes listed and pending as well as price changes for single-families, condos, and multi-family homes in Massachusetts. For New Hampshire, it presents home sale statistics and average sales prices. These factors, when compared year over year, are all indicators for predicting future trends in the market. 2019 will be examined in some areas to highlight the lingering impact of COVID in real estate.
Highlights:
- Sales and prices are up, signifying a strong market.
- Sellers still have the upper hand in this market as inventory is still a tight commodity with the increase in sales.
- Prices are still on the rise as buyers out-compete one another in bidding wars, inflating sale prices.
- There are fewer sellers listing this year than last, but the decrease in pending sales suggests that inventory may start to linger a little longer than what we’ve seen so far in 2021.
- Buyers are willing to pay what sellers want as the number of price changes is down year over year.
- Single-family homes are being sold 41% faster than last year at this time.
- Low mortgage rates should entice buyers to stay motivated to buy as rates and prices seem likely to increase as the year progresses.
Massachusetts Home Sales Up 3.1%
Sales are up just over 3% year over year with July 2021 at 10,160 over 9,851 last July. Sales declined in single families but increased in condos and multi-families. This time last year, condo and multi-family sales were down due to fears of communal living, a phenomenon now eradicated with vaccinations and safety measures in place.
- Single families: 6,765 (2020) | 6,327 (2021)
- Condominiums: 2,462 (2020) | 2,897 (2021)
- Multi-families: 624 (2020) | 936 (2021)
Single families are likely down due to extremely high demand and low inventory. As you can see, there has been a major decrease in available single families all year, though inventory is creeping back up to where it was last December.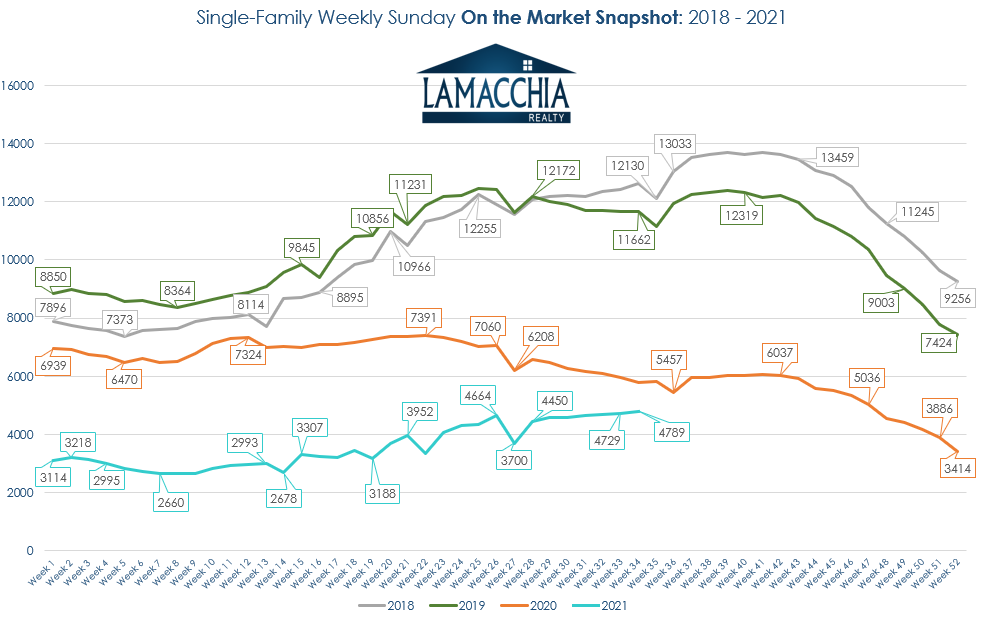
Average prices have continued the incline with another year-over-year increase of 15.3%, now at $576,247. Prices increased in every category.
- Single families: $547,248 (2020) | $650,704 (2021)
- Condominiums: $397,539 (2020) | $443,076 (2021)
- Multi-families: $552,745 (2020) | $616,804 (2021)
July 2021 compared to July 2019 performed in a similar fashion, with increases in both sales and prices.
Homes Listed For Sale:
Listings decreased year over year by 7.8% for all three categories when compared to July 2020. When compared to 2019, however, the number of homes listed is up 5.3%, which means that last year’s market is swaying this year’s performance.
- 2021 – 9,585
- 2020 – 10,407
- 2019 – 9,105
Homes Placed Under Agreement (Pending Home Sales):
Pending sales are down over July 2020 by 18%, and down over July 2019 by 6.9%. July is typically a very active time for buyers but with this year’s inventory crisis, buyers are struggling to find what they want and are also deciding to give up for another year and are resigning their leases. This decrease in pendings may be what helps lighten the pressure on what available inventory there is, giving the buyers that are still out there more selection than before. The continual decrease in the buyer pool and in pending sales points to a better time to buy in the fall.
- 2021 – 8,455
- 2020 – 10,313
- 2019 – 9,082
Price Changes:
Price changes are down 7.7% when compared to July 2020. Low inventory tends to diminish the need for sellers to adjust their prices, but if we continue to see pending sales decrease, sellers may need to take that as a cue to make an adjustment in order to attract more buyers. Price changes are also down over 2019.
- 2021 – 682
- 2020 – 739
- 2019 – 734

Highlights:
- Sales declined over last year’s frenzied market, potentially helping keep some inventory on the market for current buyers.
- Prices have continued to rise, meaning that the buyers who are out there are committed to paying what they need in order to secure a home.
- Sellers should be careful with listing too high, as prices continually increase, overpricing may detract the right buyer from making an offer. If the home sits for longer than two weeks, discuss a price adjustment with your REALTOR®.
- Buyers should also be advised that homes that are priced fairly and have sat on the market don’t necessarily have anything wrong with it, with sales decreasing, homes may not be selling as fast as the past year, but it doesn’t mean the home has been intentionally passed up by other buyers.
- Low mortgage rates should entice buyers to stay motivated to buy as rates and prices seem likely to increase as the year progresses.
New Hampshire Home Sales Down 10.4%
Sales decreased over July 2020 with fewer closings for single families and condos. Multi-families increased significantly. Sales are also down over 2019 showing that July 2021 was a slow month for New Hampshire real estate.
- Single families: 2,033 (2020) | 1,760 (2021)
- Condominiums: 547 (2020) | 483 (2021)
- Multi-families: 89 (2020) | 149 (2021)
Prices increased again, now up by 18.6% over 2020 suggesting that the rise in prices may be what’s inhibiting buyers from making offers. The remaining inventory on the market is a good sign for current buyers, as long as sellers aren’t over-pricing their homes.
- Single families: $393,298 (2020) | $473,691 (2021)
- Condominiums: $279,207 (2020) | $332,861 (2021)
- Multi-families: $343,424 (2020) | $339,790 (2021)
As you can see the market is trying to catch up to where it would have been had COVID not put a massive wrench in the works, but it’s not quite there yet.
Data provided by Warren Group & MLS
PIN for MA, and by NEREN for NH then compared to the prior year.