
This Lamacchia Mid-Year Housing Report presents overall home sale statistics as of the first six months of 2021 compared to the same period last year, January 1st to June 30th, 2020. Highlighted in this report are the average sale prices for single-family, condominiums, and multi-family homes in Massachusetts along with the number of homes listed for sale and placed under contract.
Sales Increase by 30.2%
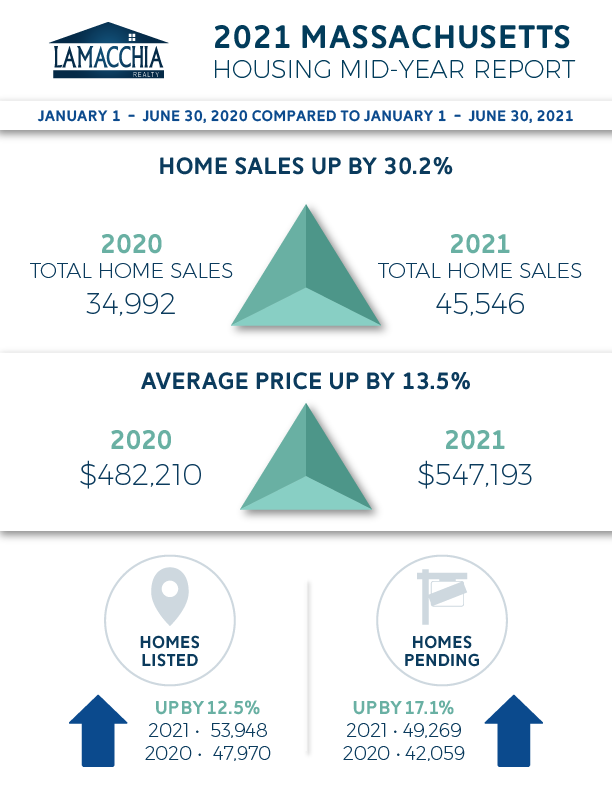
Home sales for single families, condos, and multi-families increased by 10,554 transactions, now up to 45,546 in the first half of 2021 over 34,992 in the first half of 2020.
Sales increased in all three categories, but multi-families experienced the highest rise with a 49.9% jump, then condos at 46.5%, and singles at 20.8%. Communal living is back on the table after it took a hit last year with the pandemic, and safe distance mandates were enacted. Significant increases this year are based on last year’s artificial decreases.
To review those artificial decreases caused by the pandemic in 2020 and a more accurate comparison prior, below is a graph that illustrates home sales in the first six months of the year since 2018.
You can see 2021, in the orange, has not only beat out 2020 every month but also increased over 2019 in five out of the six months.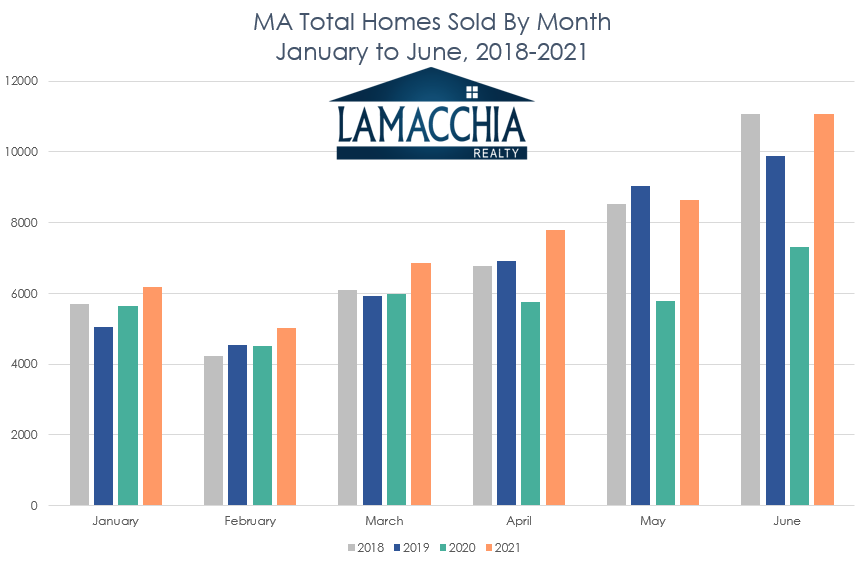
Prices Up 13.5% in Massachusetts
Rising prices have been the name of the game this year, and true to form, prices increased in all three categories, now up to an average of $547,193 from $482,210 in the same period last year. Buyers have had to compete harder than ever to get their offers accepted, with waived inspections, over-asking offers, and bidding wars. All of these factors have caused prices to skyrocket.
Singles increased by 18.9% to $620,187 due to very high demand and tight inventory, condos increased by 5.6% to $414,673, and multifamily prices rose 9.6% to an average of $589,556.
As you can see in the graphic below, 2021 prices increased over 2020 every month so far this year. The last few years have exhibited the same upward pattern, but 2021’s increase from April thru June have been much greater.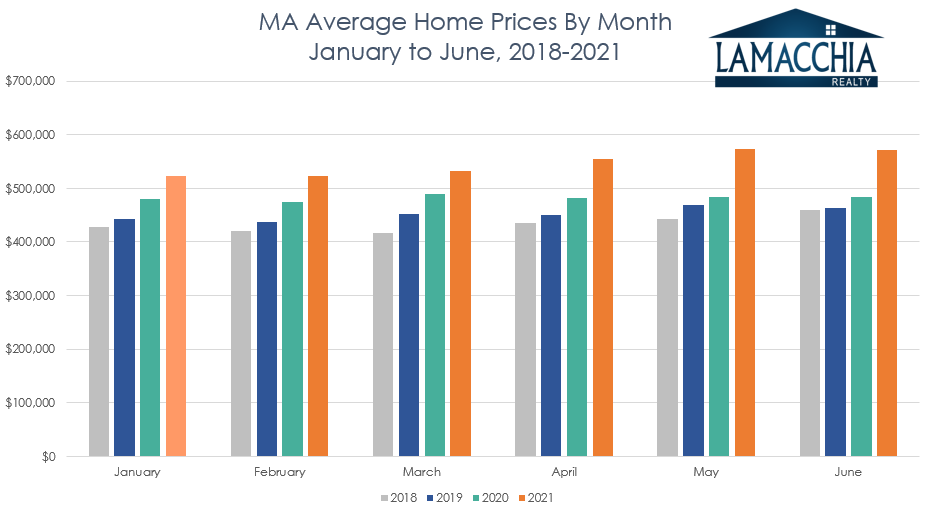
Homes Listed for Sale:
New active listings increased in the first half of 2021 over the first half of 2020 by 12.5%, with 53,948 homes placed on the market compared to 47,970. An increase in the number of listings is good news, considering how historically low the supply of homes has been over the past year. We are hoping to see more homes listed over the next few months, making it potentially a very good fall to buy. Sellers who pulled their necks in during the pandemic have listed now that the world has opened back up again. Buyers who have secured homes with home-sale contingencies are now under obligation to list their homes and thus the predicted continual increase in listings over the summer.
Pending Sales:
The number of homes with contracts accepted has also increased year over year, up by 17.1% over 2020, now at 49,269 from 42,059. The increase in pending sales has been what consumes whatever listings are available. So, while seeing an increase in the number of listed homes is beneficial to the market, one also has to take the number of homes that are being pulled from the market as buyers scoop them up. In this case, there were 5,978 more listings this year but 7,210 more pendings this year. The growth in pending sales therefore trumped the growth in the number of listings. This is the game of supply and demand which has put the real estate market into a frenzy.
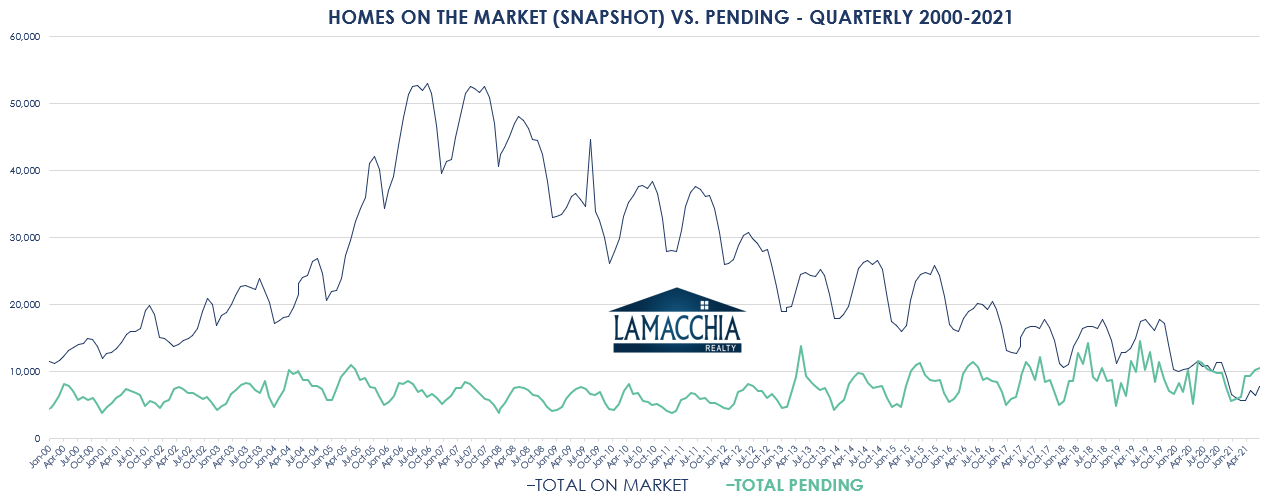
The chart below is very telling about the story of supply and demand. If you review the last year, the total number of homes on the market (blue line) has been almost the same or lower than the number of homes with contracts accepted. This speaks to the ‘absorption rate’ of homes. It’s a ‘typical’ real estate market with about 4 months of supply available on the market. June of 2020 when there were 10,096 homes on the market and 10,313 contracts accepted, the absorption rate of 105% meant we had less than one month’s supply. In June of 2021, with 7,699 homes on the market, and 10,542 homes that went pending, it was even tighter with a 137% rate (green line).
The other point to make here is that there was great concern that the pandemic was going to incite a housing crisis like 2008. As explained very early on in the pandemic by Anthony Lamacchia, 2020 was nothing like 2008. If you find 2008 and the couple years leading up to it on the chart, you’ll see the opposite circumstances came to fruition than what we are experiencing now. Supply was at an all-time high, and the number of homes that were being purchased was lower than it is now. Now, supply is at an all-time low, and the number of contacts accepted has increased.
Predictions for the Rest of the Year:
The first half of 2021 has been a race for the real estate market to catch up. Sellers had the upper hand as the number of buyers significantly outweighed the number of homes on the market. Prices were driven up by homes selling with over-asking offers. Anthony’s 2021 predictions are still holding true, even halfway through the year: 2021 will be the biggest year for home sales since 2005 and Massachusetts will break the 100,000 sales in a year barrier; a level unreached in 15 years.
Buyers were able to sustain the rise in prices due to the drop in mortgage rates. They have been historically low, as driven by the Fed purchasing mortgage-backed securities, which is predicted to begin tapering off by the end of this year and potentially causing mortgage rates to start gradually increasing by the end of 2021. But as it currently stands, rates are so low that buyers who were pre-approved even a couple months ago should consider having their rates revised with their lender. The recent drop helps drive purchase power-up and gives buyers room to afford more house or a higher offer.
Sellers are beginning to list more and more. There are still many buyers out there consuming the inventory, but as those buyers secure their new homes and list their current homes, or as buyers drop out the race, pause their search and re-sign leases, listings may start to linger on the market a little longer that we have seen.
Over the past year, some homes were selling in a day. Buyers should be advised that if they see a home they like that has been available for more than a week, to not assume there’s something wrong with it. If supply increases, listings may last a little longer. That’s a good thing for the frustrated buyers who’ve had to compete hard for homes.
The hopeful prediction is that sellers will continue to list their homes in hopes of finally upgrading or downsizing and the market will hopefully balance out a little more. Doing so now would be the smartest thing for those who are considering selling. Not only will they be able to still take advantage of the demand, but buyers still have the purchasing power to make strong offers with the lower mortgage rates. Many sellers become buyers once their home sells (or vice versa). So those sellers will then be able to take advantage of the rates. The more sellers sell, the more listings the market will offer, the more selection buyers will have, the happier everyone will be.
Data provided by Warren Group & MLSPin and compared to the prior year.