The Lamacchia Realty South Florida Housing Report presents overall home sale statistics and highlights the average sale prices for single families, condominiums/townhomes in Broward County, Miami-Dade County, and Palm Beach County for March 2021 compared to March 2020. It also looks at other metrics like New Listings and New Pending Sales as they are often the best indicators for predicting future trends in the market. This month’s report will be unlike years past due to the lingering effects of COVID and the massive amount of home sellers that didn’t list last year., and so 2019 will be discussed to compare this month to a market not impacted by a pandemic. In addition, we have to be aware of the fact that COVID 19 really got going and shutdowns were put in place in the middle of March last year so it impacted homes listed, home pending, and homes sold in March 2020. That is part of the reason that we go back to 2019 so that we can get a bigger comparison.
Broward County
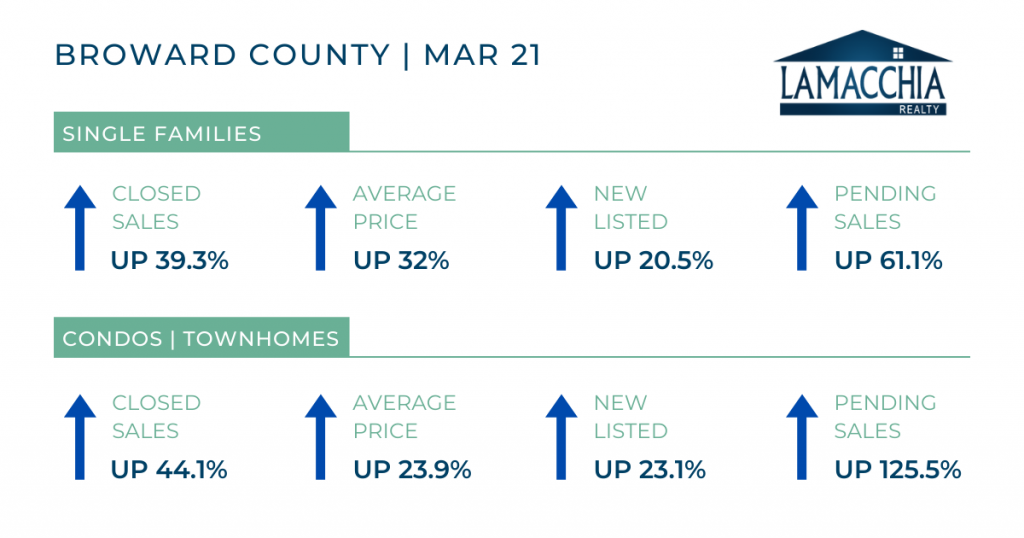
Sales, average prices, the number of new listings, and the number of properties placed under agreement all increased in Broward County in March 2021 over the same timeframe in 2020.
Broward County closed sales increased by 39.3%, 528 sales year over year when comparing March 2020 to March of 2021. 2021 saw 1,870 sales over 1,342 last year. Condos/townhomes increased by 44.1%, now at 2,151 sales over 1,493 last March.
Single family and condo/townhouses increased by 32% and 23.9% respectively. Single family prices are up to $662, 637 from $502,111 – a $160,526 increase year over year. Condos/townhome prices increased to $292,386 over $235,919.
New listings increased to 2,213 from 1,762 for single families, a 20.5% increase. Condos/townhomes listings moved from 1,928 to 2,373, a 23.1% increase. These numbers are significant increases over last year, but that’s due to the COVID pandemic slowing the market down. If you compare 2021 numbers to 2019, the increases are much less significant which shows that the Broward County market is now back to where it should be, with single listings only increasing over 2019 by 1.5% and condos/townhomes increasing by 6.6%.The number of homes placed under agreement increased by 61.1% for single families and by 125.5% for condos/townhomes. There were 2,211 single families placed under agreement in 2021 over 1,317 in 2020. 2,785 condos/townhomes were placed under agreement over 1,235 in 2020. Those are major increases year over year, but again, comparing the 2021 numbers to 2019, the increases weren’t as significant. Singles over 2019 increased by 14.4% and condos/townhomes increased by 42.2%- still high but not as astronomical as 125.5%.
Miami Dade County
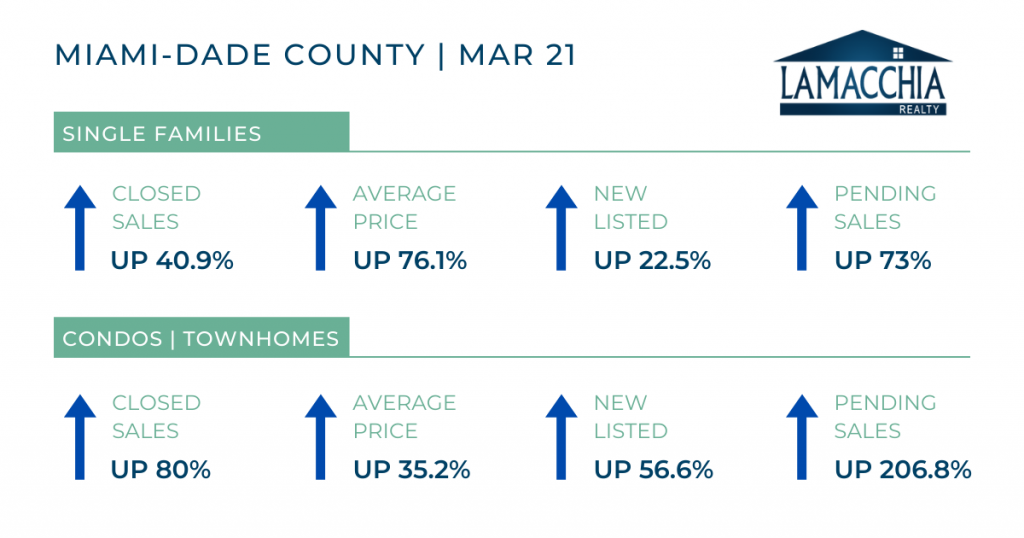
Miami Dade increased in sales, average price, new listings, and the number of pending sales when compared year over year.
Sales for single families increased by 40.9% now up to 1,550 from 1,100 in 2020. Condo/townhomes increased by 80% now at 2,201 from 1,223 in 2020.
Average prices increased by 76.1% for singles and by 35.2% for condos/townhomes. Single family prices averaged $1,026,562 over $582,891 last March and condo/townhomes averaged $616,639 over $456,098. Low single family inventory and very high demand is the cause of such a large increase in prices for single families.
The number of new listings increased by 22.5% for single families and by 56.6% for condos. There were 1,892 single family listings added in March 2021 over 1,545 last march. There were 2,861 condo/townhome listings over 1,827 in March of 2020. Similar to Broward county, the 2021 numbers are much closer to 2019 numbers- but the March 2020 covid shutdown halted sellers from listing thereby creating the declines last year and making 2021 seem like numbers are high when really it’s the market playing catchup.
The same game of catch up happening for the number of homes placed under agreement where 2021 over 2020 percent changes are much higher than the change from 2019. There were 1,505 single families placed under agreement in 2019, 1,141 in 2020 (a decline due to COVID), and 1,974 in March of 2021, a 73% year over year change. Condo/townhomes did the same thing: 1,580 went pending in 2019, 1,007 in 2021, and 3,089 in March of 2021, a 206.8% year over year change. Buyers are making up for lost time.
Palm Beach County
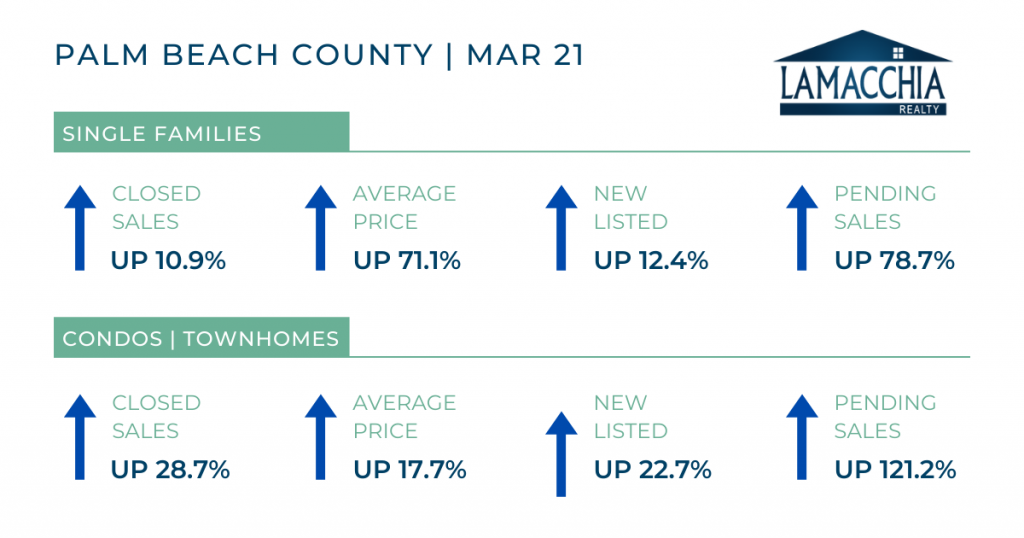
Sales, average prices, the number of new listings, and the number of properties placed under agreement all increased in Palm Beach County in March 2021 over the same timeframe in 2020.
Sales increased by 10.9% for single families and by 27.8% for condo/townhomes. There were 1,723 single family sales in March 2021 over 1,554 and 1,639 condo/townhome sales over 1,282 the year prior.
Average prices increased by 71.1% for single families and by 17.7% for condos/townhomes. Singles are now at $1,045,598 over $611,000 and condos/townhomes averaged $418,611 over $355,747.
New active listings for single families increased by 12.4% year over year and by 22.7% for condos/townhomes. There were 2,144 listed over 1,908 singles listed in 2020 and 1,921 condos/townhomes listed over 1,565. If you compare 2021 numbers to 2019 however, the number of listings for both single families and condos/townhomes exhibited only slight changes; singles decreased by .2% and condos/townhomes increased by just under 9%. This shows that 2021 numbers are neck and neck with 2019 and are seemingly much higher than 2020 due to the market halt during the shutdown.
The number of pending sales increased by 78.7% for single families and by 121.2% for condos/townhomes. Single family pending sales reached 2,412 over 1,350 and 2,197 condos/townhomes went pending over 993 in March 2020. Just like listed homes, 2021 landed just about where you’d imagine they’d be when compared to 2019 and seemed like giant increases over 2020 because of those isolated market conditions.
What’s Ahead?
The numbers for the next couple of months are going to seem like major year-over-year increases due to the impact of the pandemic shutting down the market this time last year. 2021 over 2020 will exhibit statistically significant changes but if you compare 2021 to 2019 the changes won’t be as great. The number of homes listed and pending is going to be impacted the most due to this phenomenon.
Average prices are skyrocketing year over year partially due to inventory being so tight and demand being so high, but also due to a number of super high-priced homes being sold as international owners are listing their luxury homes.
Due to the single family inventory crisis, buyers who were looking for detached living are giving in and making offers on condo/townhomes to take advantage of the lower mortgage rates while prices continue to rise.
*Data provided by Florida REALTORS® SunStats
