
The Lamacchia Housing Report presents overall home sale statistics and highlights the average sale prices for single families, condominiums, and multi-family homes in Massachusetts and New Hampshire for August 2020 compared to August 2019. It also looks at other metrics in Massachusetts like Homes Listed for Sale, Homes Pending, and Price Adjustments made to active listings, as they are often the best indicators for predicting future trends in the market.
This month’s report will be unlike years’ past due to the lingering effects of COVID and the massive amount of home sellers that didn’t list their homes in late March and early April when the lockdown first hit.
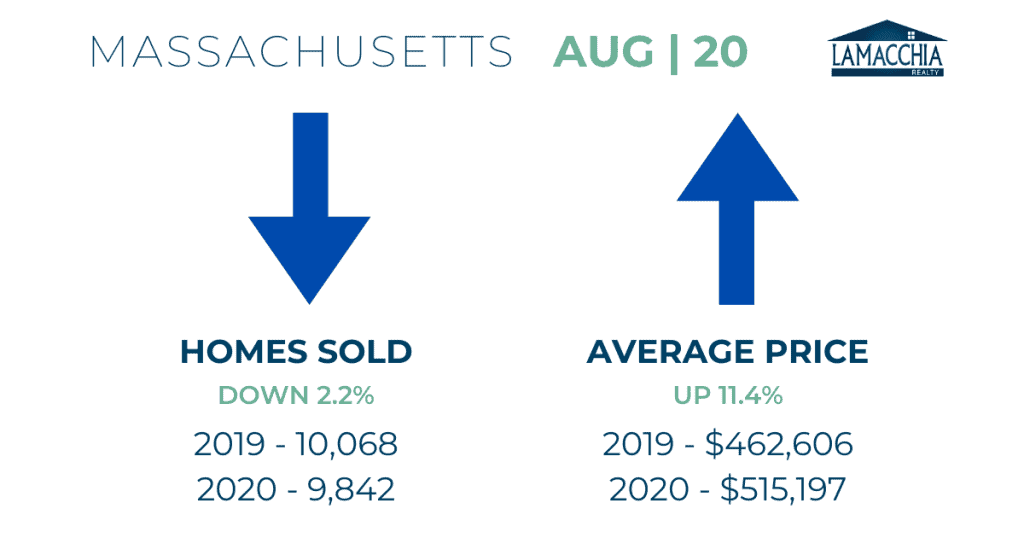
Massachusetts Home Sales Down 2.2%
Sales in Mass. are down over August 2019 by 226 sales, slightly over 2%. Sales increased under 1% in single families but decreased in condos and multi-families.
Prices have increased again by 11.4%, $52,590 overall in Massachusetts to $515,197. All three categories increased in prices. When demand is high and supply is low, sell prices increase naturally with buyers outbidding one another.
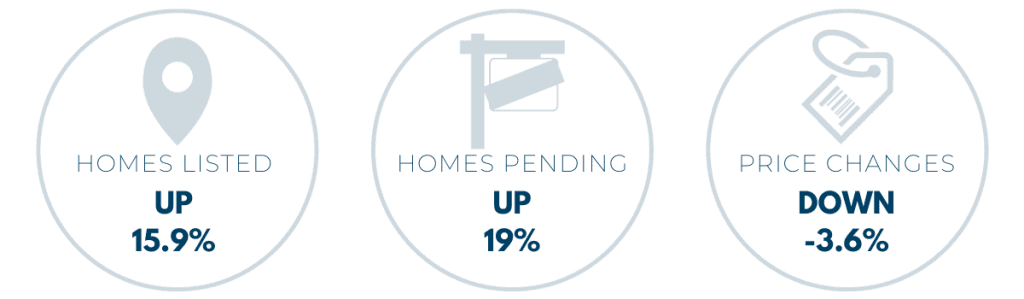
Homes Listed for Sale:
For the second month this year, the number of homes listed exhibited an increase which is a positive sign for buyers. There were an additional 1,336 homes listed in August 2020 over August 2019- an almost 16% increase. It’s a hopeful sign that this imbalanced market is starting to tip towards the buyers’ favor and be a less competitive environment for buyers than it has been all year.
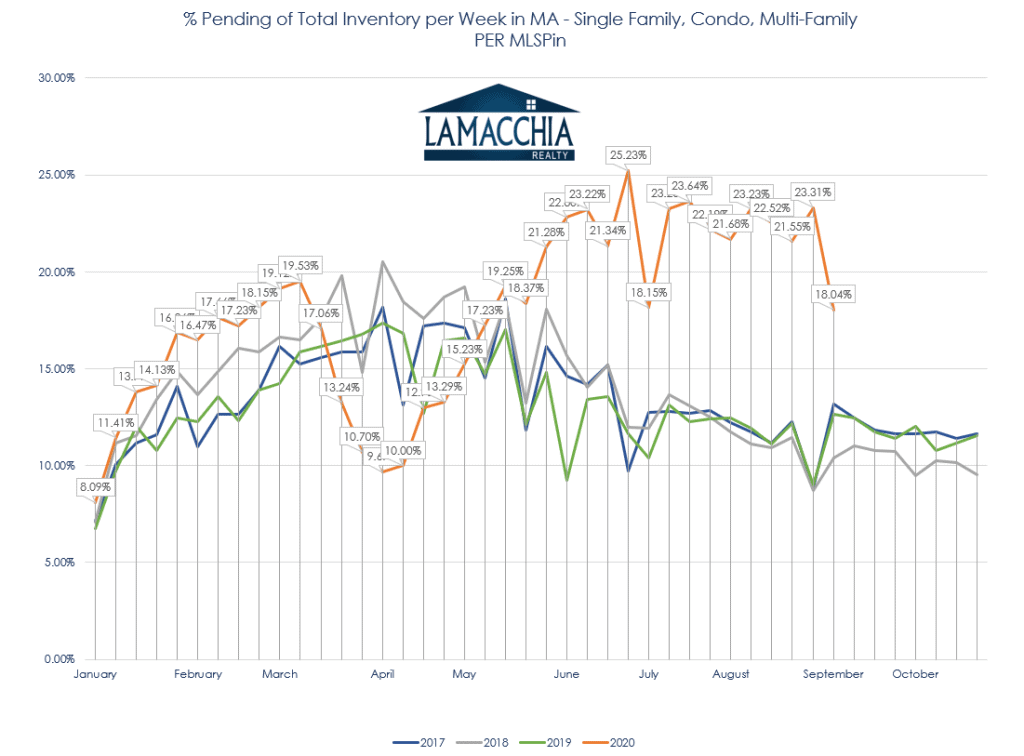
Pending Home Sales:
Pending home sales are up by 19% over August 2019 which shows that this market is highly active. The historically low mortgage rates have helped give more buying power in multiple offer situations and have provided an incentive for frustrated buyers to stay out there as it’s almost unheard of to see 30-year loans under 3%.
As you can see in the chart below, the number of homes that have gone pending this year over last year is higher in the past few months than it has ever been.
Price Changes:
Price changes (reductions) decreased by 3.6% over August 2019 which shows that buyers are willing to pay what sellers want- particularly if the house is priced well. In this market, if you are not getting almost immediate offers it’s likely that your price point is higher than your target buyer’s price point and you should discuss it with your Realtor. Often if a home is priced appropriately, you’ll get more than one offer which could drive the sale price up.
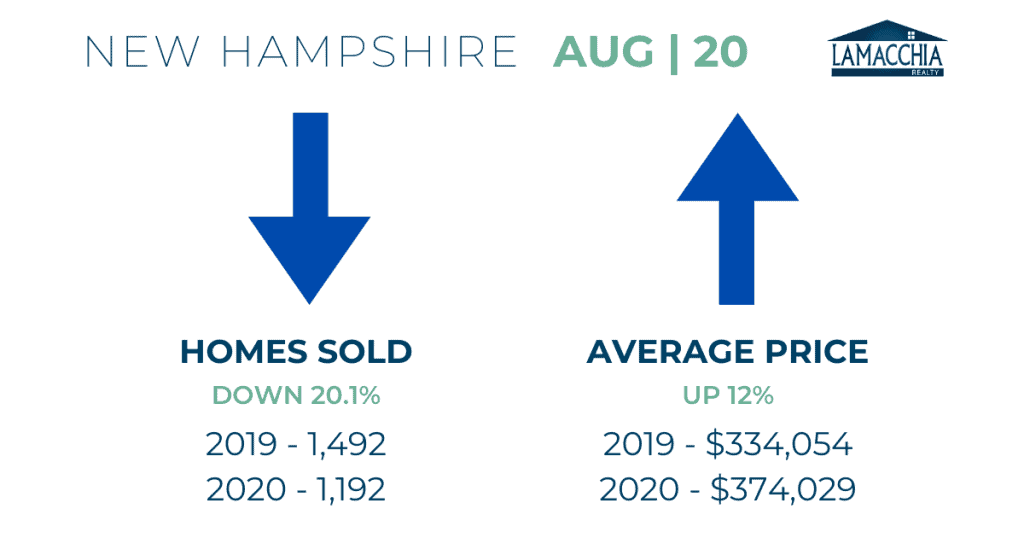
New Hampshire Home Sales Down 20.1%
New Hampshire exhibited a decrease in sales and an increase in prices when compared to August 2019. Sales saw a 20.1% decrease with 300 fewer sales. There was a decrease in sales in single and multi-families and a slight 0.6% increase in condos. Average prices increased by 12% in all three categories to $374,029.
What’s Ahead?
We hoped that we’d see a post-Labor Day spike in the number of homes listed, and fortunately for buyers, it seems like that’s going to happen if this upward trend persists.
Safety guidelines and historically low mortgage rates have helped perpetuate the market despite the historically low supply of homes. Typically fall lessens the tension in the market for buyers as competition for homes diminishes slightly and there’s hope that we will see a bit of this in the next few months.
The market is trying to catch up to where it would be had COVID not put a massive wrench in the works, but it’s not quite there yet.
Those interested in listing in Fall should have their homes prepared as soon as possible to attract motivated buyers. If a sell/buy is in your future, your realtor will help you devise a selling and buying timeline that works for you and your goals.