

The Lamacchia Housing Report presents overall home sale statistics and highlights the average sale prices for single families, condominiums, and multi-family homes in Massachusetts and Southern New Hampshire for August 2019 compared to August 2018. It also looks at other metrics in Massachusetts like Homes Listed for Sale, Homes Pending, and Price Adjustments made to active listings, as they are often the best indicators for predicting future trends in the market.
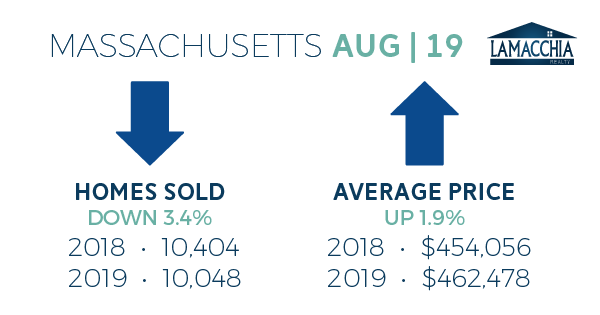
Massachusetts Home Sales Down 3.4%
Massachusetts home sales decreased year over year in all three categories by 356 sales and prices increased by $8,422 overall.
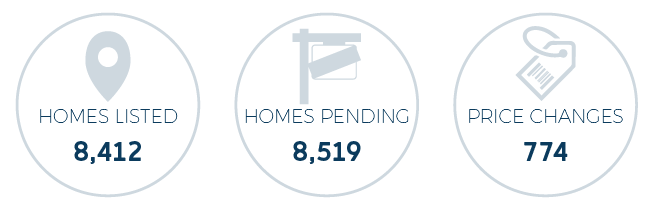
Homes Listed for Sale:
August 2018 had more homes listed for sale as we saw an 11% decrease this year. There were 1,042 fewer homes placed on the market in the past month compared to last August. Many tend to wait to list their homes until after Labor Day, so we will have to see what the numbers did next month.
Pending Home Sales:
There were 46 fewer homes placed under agreement in August 2019 compared to August 2018 depicting a 0.5% decrease in Pendings. With inventory as low is it was, it’s no surprise that the number of homes put under agreement is down. Inventory shifts in the Fall and these numbers will likely flip into the positive.
Price Changes:
August 2019 had 160 fewer price adjustments than August 2018 – a 17% decrease. This number is probably relative to the decrease in the number of homes listed for sale, but it is definitely related to the decrease in the number of homes placed under agreement. If sellers want to sell after they’ve been on the market for a few weeks, a new listing price is in order.
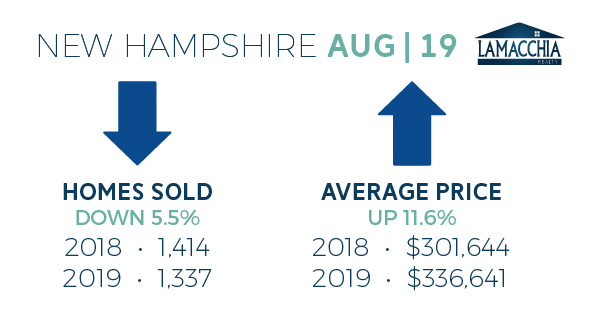
Southern New Hampshire August Home Sales Down 8.8%
Like Massachusetts, Southern New Hampshire exhibited a decrease in sales and an increase in prices. Sales are down by 77 transactions, and prices increased by $34,997 year over year, about 11.6%.
What’s Ahead?
Buyers start your engines. We are quickly approaching the best time of the year to buy, and with inventory performing as it is, it’s the best time to buy since 2014. Though in August, we still saw a decrease in the number of homes listed (AKA new inventory) every September exhibits a significant spike (the second largest in the year) giving buyers the selection they’ve been craving all summer.
Sellers tend to wait until after Labor Day to get their homes officially listed, and we are in that sweet spot where we are seeing inventory rise. September and part of October are the highest before inventory diminishes again for the new year.
Sellers, you’ve had the upper hand over the past few months – hungry buyers have competed over your homes which lead them to sell relatively quickly. If not, price is likely the issue – despite what you may want to hear. If your listing is still lingering, speak with your Realtor about retargeting your listing price to attract buyers and beat out the competition before the spike in inventory really hits you.
Buyers tend to think something is wrong with a house when it sits on the market for too long – which is why the faster it sells, the more it sells for. But buyers, be advised, there is likely NOTHING wrong with that house. Understanding how the market conditions can affect the number of days a house takes to sell might help you not overlook the perfect house and get you the deal you’ve been looking for.